Forex market is the market consists of huge risk. It consists of many risks that most of the trader fails. It is estimated that around 96% of traders lose money in this market and end up quitting. What is the reason behind most people fail in this market? There are two main reasons, why traders fail in the foreign exchange market:
- Lack of knowledge and trading strategy
- Loses due to the broker
A new trader is unaware of forex market strategies and trading techniques, he also doesn’t know whether he should trade on public holidays or not. It is not advisable to trade on public holidays because it is the time when the liquidity and volatility are very low. Forex traders need to find those indicators which are most profitable and can help in maximizing their profit.
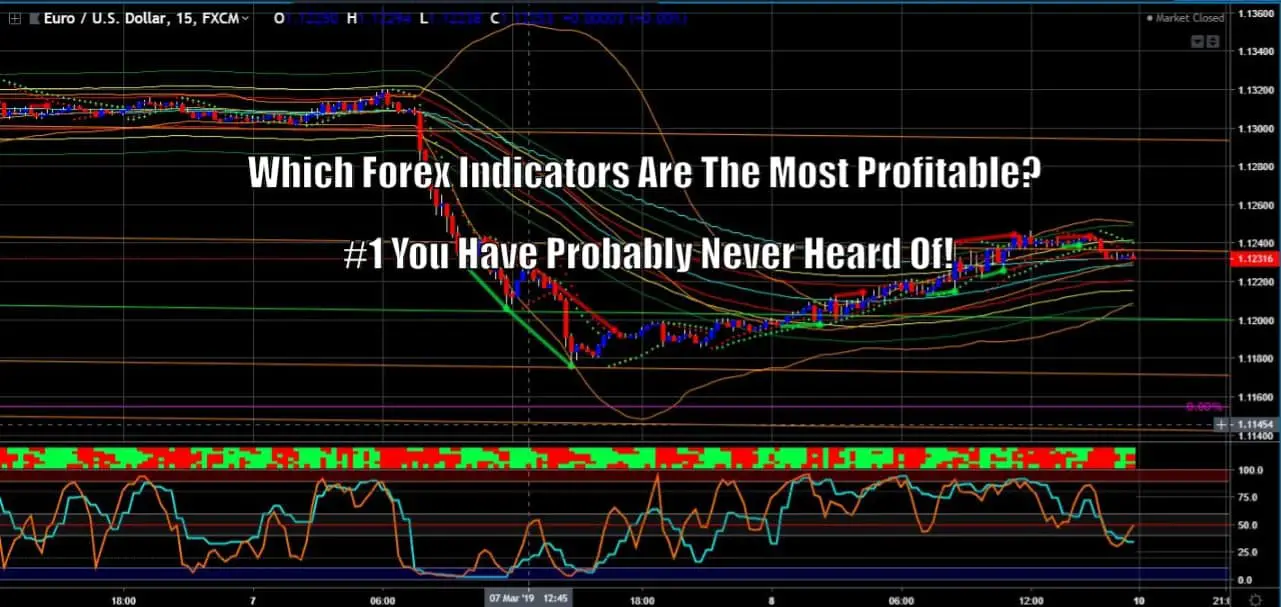
So, which forex indicator most profitable? Technical indicators are divided based on the purpose. Moving Average forex indicator is one of the best technical indicators to identify and follow the trend. While there are many other technical indicators which help a trader in making the trading strategy. They are Bollinger Bands and MACD which are old paradigm trading. The most profitable happens to be in the New Paradigm using real time indicators that include TAB29 created by Steve Gregor.
OLD PARADIGM VS NEW PARADIGM
Forex indicators are very effective in forecasting the fluctuating price. But here the main thing is which indicator you are using, an ineffective indicator may lead to huge losses. Hence, it is better to find a perfect indicator. The result of an indicator helps in estimating the price.
A new trader should learn daily about this market and keep learning because foreign exchange market has the wide concept. To become a successful trader, it is necessary to learn technical analysis and technical indicators are a big part of technical analysis. Mainly there are two types of forex analysis: Fundamental analysis and Technical analysis.
Fundamental analysis is the market analysis in which a trader needs to pay attention to fundamental factors like, GDP, Inflation, manufacturing or production, economic growth etc. Technical analysis consists of many methods or indicators which can help in estimating the future price.
Technical Analysis
Technical analysis is effective in the estimation of future price movements in the forex market. This estimation of future prices is done after analyzing the data of past market and on the basis of the data collected, forex market forecast is done.
When a trader identifies a repetitive pattern of the market price in the past data, the forecasts based on it. A trader can rely on price charts, volume charts and other mathematical representation of market data to discover an ideal entry and exit point.
Technical analysis includes technical indicators. Technical indicators are a big part of it. To forecast the prices effectively through various methods or indicators of technical analysis, it is also important to select an ideal and profitable technical indicator for the same.
Profitable Indicators for Forex Traders
In technical analysis, there are many indicators, but the effective trader selects the best and profitable indicator for the estimation of price movements. Here are some profitable indicators for forex traders:
1. TAB29 (Tops and Bottoms Indicator using 29 indicators all in one)
I am a little bias here of course with this one because it is my main indicator I use in all trading and is created by Steve Gregor.
This indicator can be used to for precise reversals where you can use down to a 3 pip stop loss. This essentially means the potential to have 5X-10X more profit per trade. If you would like to read more on this and the new paradigm you can go to our New Paradigm page and see how to get invited to Steve Gregor’s free facebook group on Trading Scans, Forks, Fibos and Waveology.
Traders can also use this indicator for trend continuation trades that are very easy trades once you get your Volume Of Traders in by demoing.
Harmonic Wave Convergence indicated in TAB29 Indicators is the occurrence of 2 or more levels of cyclical waves (“harmonic”) exhausting (terminating) at precisely the same time and price. When this convergence takes place, price will almost always reverse” – Steve Gregor
As stated previously with this indicator you have the ability to use a 3-10 pip stop loss compared to a 30-60 pip stop loss in old paradigm trading (I still do trade old paradigm as well). So for both these stop losses you should be using around a 1-3% risk meaning that with a 10 pip stop loss you are gaining 1-3% per 10 pips where with the 60 pip stop loss you are gaining 1-3% every 60 pips. This equates to roughly 6 times more profit using this indicator.
Pros of TAB29
- Great for confirmation of reversal zone
- Can provide multiple entries after a reversal
- Gets you in profit quickly and also prevents losses once in profit
- Cuts down time on the charts greatly
Cons of TAB29
- TAB29 can be traded stand alone but it is not meant for that purpose you should use extra confirmations such as: Fib Channel, Fib Retracement, Harmonic Patterns, Pitchforks, Trendlines, etc.
- Is not just a plug and play strategy there is a lot to learn and demoing is a must to learn what not to do
- Need to be on the charts to trade this isn’t a this indicator says buy lets by and head for the beach but you are in and out of trades quickly
2. Moving Average
Moving Average indicator is one of the best and profitable technical indicators a trader should use. Moving Average is a trend indicator, helps you in identifying and following the trend. It shows an average value of price chosen over a time period.
In simple terms, MA follows the forex market price. The indicator helps in lining the smooth volatility and avoiding unwanted price noise. Moving Average indicator helps in outlining the current direction of the market and not predicting the future forex market price. Mainly, there are four types of Moving Averages – exponential, linear weighted, simple and smooth. The differentiation among them is merely technical.
So, Moving Average (MA) shows whether to buy a currency pair or sell it. But, it won’t tell at what level to open your trade, for that you need other technical indicators.
Pros of Moving Average
- It finds trends reversals
- It shows resistance levels and potential support
- It helps in identifying the direction of a trend.
Cons of Moving Average
- Moving Average lags behind the present price.
3. Bollinger Bands
Bollinger Bands is an indicator to measure market volatility. This indicator is helpful in a sideways market. Bollinger Bands consist of three lines. Each line or band is a Moving Average. The middle band or line helps in identifying trend direction which is 20-period SMA. Out of three bands, upper and lower bands are shifted by 2 standard deviations above the middle line/band and below the middle line/band.
Bollinger Bands indicator is effective when the market is not trending and this indicator alone is not enough, a trader should also use other indicators to get the most from this method.
Hence, the Bollinger band is an indicator which puts the price in a type of box between two outside bands. The market price constantly revolves around the middle line, only for a short period of time.
Pros of Bollinger Bands
- The Bollinger Bands indicator is very effective in a sideways market when the currency pair is trading in its range area.
Cons of Bollinger Bands
- When there is a strong trend in the market, the price can spend a long time at only one Bollinger band and does not go to the opposite ones. As a result, it is ineffective in some ways.
4. Moving Average Convergence/Divergence (MACD)
This indicator measures the driving force behind the market. It helps in showing when the market is tired of moving into one direction. Moving Average Convergence/Divergence (MACD) is the indicator based on the Moving Average method. It belongs to a kind of technical indicator which is known as oscillators. Oscillators are shown separately in a box when the oscillators rise to its high level; it has to fall down back.
Moving Average Convergence/Divergence indicator is effective in the measurement of the market trend and momentum. So, it is very important to have MACD on the chart. This indicator could be a strong part of your trading systems and strategies. Although, many traders do not recommend to make a trading decision based on this indicator because, it lags behind the price chart.
Pros of MACD
- It can be used for both ranging markets and trending markets.
- It becomes easy for you to learn oscillators when you understand MACD.
Cons of MACD
- The MACD indicator lags behind the price chart.
- As some signals come late, they are not followed by the strong move of the market.
Conclusion
So mainly, there are two types of forex analysis are- Technical analysis and Fundamental analysis. Fundamental analysis is the market analysis in which the trader pays attention to fundamental factors of the market like, manufacturing or production, economic growth, GDP etc. While in technical analysis, there are many technical indicators included.
A trader should find the technical indicator which is effective and which can be most profitable indicator for him. Technical indicators are based on the purpose. For example, the Moving Average indicator is the best to identify and follow the trend. The MACD indicator is the best driving force behind the market and Bollinger Bands indicator is the ideal forex indicator for the measurement of volatility.
So, good technical indicators are very useful in getting the trading signal. You can follow above-mentioned indicators to get a good forex trading signal. If you are ready to make 5-10X the amount per pip I suggest you get in contact with me so I can get you into Steve Gregors free group and on your way to success.