Most traders will use indicators like RSI, MACD, Stochastics, CCI or even Stochastic RSI (like this one) to decipher when a currency pair is overbought or oversold to get an entry or exit. If you add in what is called divergence you can spot a market reversal usually with much more precision based on this.
So how do you trade divergence in forex? When price action is going the opposite way of an indicator like RSI you are then looking to get into the trade with any other confirmations you use for your strategy. This could be price action or maybe a 2 pip bounce off a traditional Pitchfork.
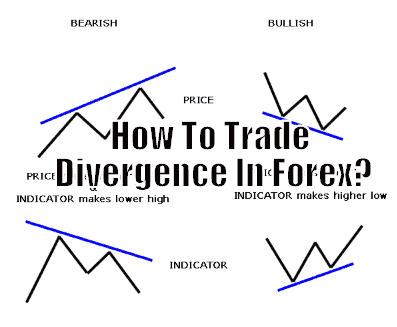
If you don’t understand divergence we can go a little further into it here. Divergence actually means to separate just like the movie Divergence where something is different (one of my wife’s favorite movies).
It boils down to the indicator and price action telling two different stories one is going up and the other is going down or vice versa. You can see on the chart below the red trend lines drawn show divergence.
On the price action it is showing higher highs and on the RSI it is showing lower highs meaning a reversal is coming. This is on a 1M chart and it still does work however with smaller time frames you are probably going to be using tighter stop losses so make sure you measure based on the close of the candle (body) and not the wicks. It doesn’t matter as much on higher time frames but if it is close it may not be a divergence.
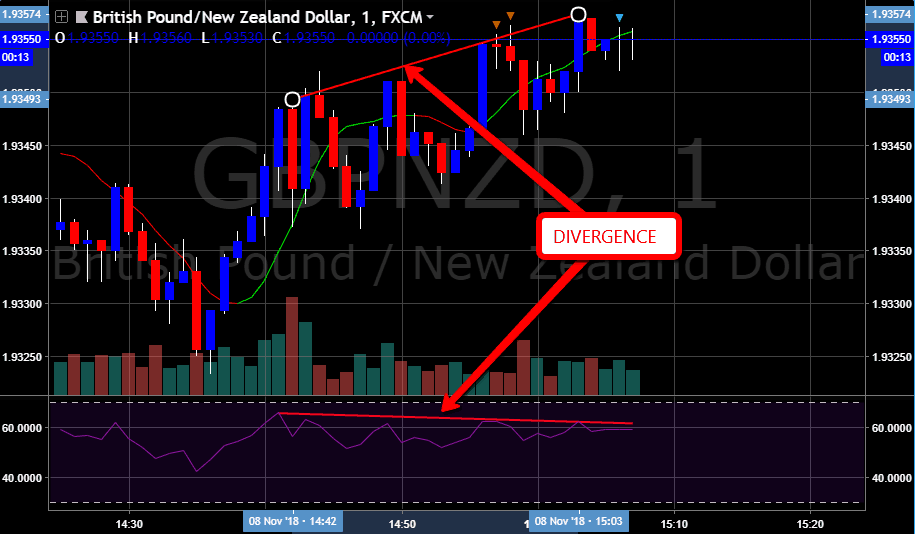
1M Bearish Divergence Using RSI
Link to Chart: https://www.tradingview.com/x/USer5XGQ/
Divergence really is as simple as that if you trade the reversals. There is also continuation divergence or hidden divergence but we probably won’t get into that in this article.
It really doesn’t matter what indicator you use as they will pretty much show the same thing. You can also back-test divergence to get a better view of this on the charts. Once you try looking for it time and time again you will start seeing it without having to draw the lines even.
However I have developed an indicator that will show you divergence without looking as well I do suggest you try this on your own. This indicator is 100% free you do however need a free account for tradingview if you don’t have one sign up here and you also get any future indicators I develop for free as well.
Trading divergence is 100% accurate that is why most traders use as a confirmation or first indicator that the reversal is coming. There is a strategy I use with harmonic patterns that is called QuickFire that uses divergence as one of its confirmations you can also check out that strategy here it is a new paradigm trading technique that has a better risk to reward than most scalping strategies.
Easy ways to decide if it is even worth looking for divergence:
- You need to see a higher high or lower low if price is consolidating don’t even both not worth the trade
- You can also look for double tops or bottoms
If you are late to the game and missed the divergence don’t just jump in there will always be more instances so be patient.
How Do You Trade Regular Divergence?
Regular divergence is what we discussed above where you are looking for the reversal. There are many strategies that use divergence one being the QuickFire Strategy I discussed. In this kind of trade you are looking for price to meet a set of rules where it hits those bands on the outside there, touches the green harmonic entry line, RSI is above 70 or Below 30 and is also showing divergence.
Then you actually look for the entry. For most people that are just starting out with this strategy they simply look for a 5M engulfing candling in the direction of the trade.
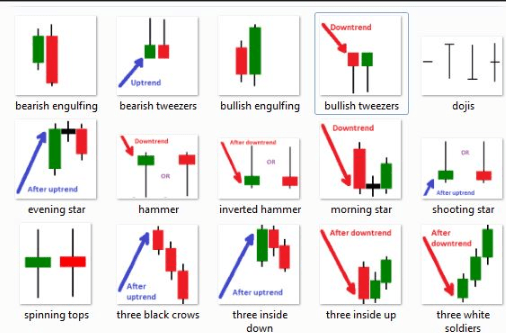
Other strategies just us a resistance zone ore a candle reversal pattern like the below pic.
How Do You Trade Hidden Divergence?
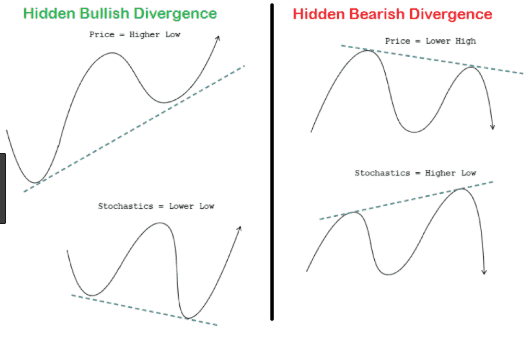
First off what is hidden divergence? We have gone over regular divergence which signals a trend reversal is coming. Hidden divergence is when a trend continuation is going to happen and a lot of times this is a much stronger or impulsive move to the upside or downside.
These can be much easier trades or at least they are in my case. When you are looking for the bottom or top it can be tough especially if there is a fakeout. The best way I have found to trade hidden divergence is with a trendline and a 2 pip pullback. This way you can use a tighter stop loss as well.
The old saying the trend is your friend comes into play here because it is either going to keep going down, consolidate, or reverse.
Hidden bullish divergence is in a uptrend and hidden bearish divergence is in a downtrend.
When you are looking to trade this strategy always remember these are not stuck to any timeframe you can use divergence on any timeframe you choose just make sure the other parts of your strategy follow the timeframe.
How Do I Trade RSI Divergence?
RSI Divergence is actually what I have pictured above. I find RSI easiest to draw divergence on because it is a single line so you may want to start with this indicator for learning about drawing these on your own.
Below are a couple examples showing this. So after you get done reading this jump on a chart either on your MT4 or Tradingview and start looking left for examples of divergence. It is always fun, especially at first, to back test things and get it down so when you start demoing your strategy it is much easier to enter a trade.
Also make sure you stick with the timeframe for your strategy I usually leave my RSI setting to default (14) for most all my trading needs. There are times when I drop it to 7 for a couple different scalping strategies but I don’t do that too often.