Drawing support and resistance can be the backbone to any trading style. Luckily in TradingView their drawing tools are amazing and continue to improve as they come out with constant updates based on user feedback. So if you don’t like something or want something added make sure you send in a support request to TradingView directly.
So how do you draw support and resistance lines TradingView?
You can easily draw support and resistance lines in TradingView by first starting up a time frame or 2. So if you trade 1 hour then go up to 4 hour or Daily to draw your support and resistance lines. Then follow these instructions:
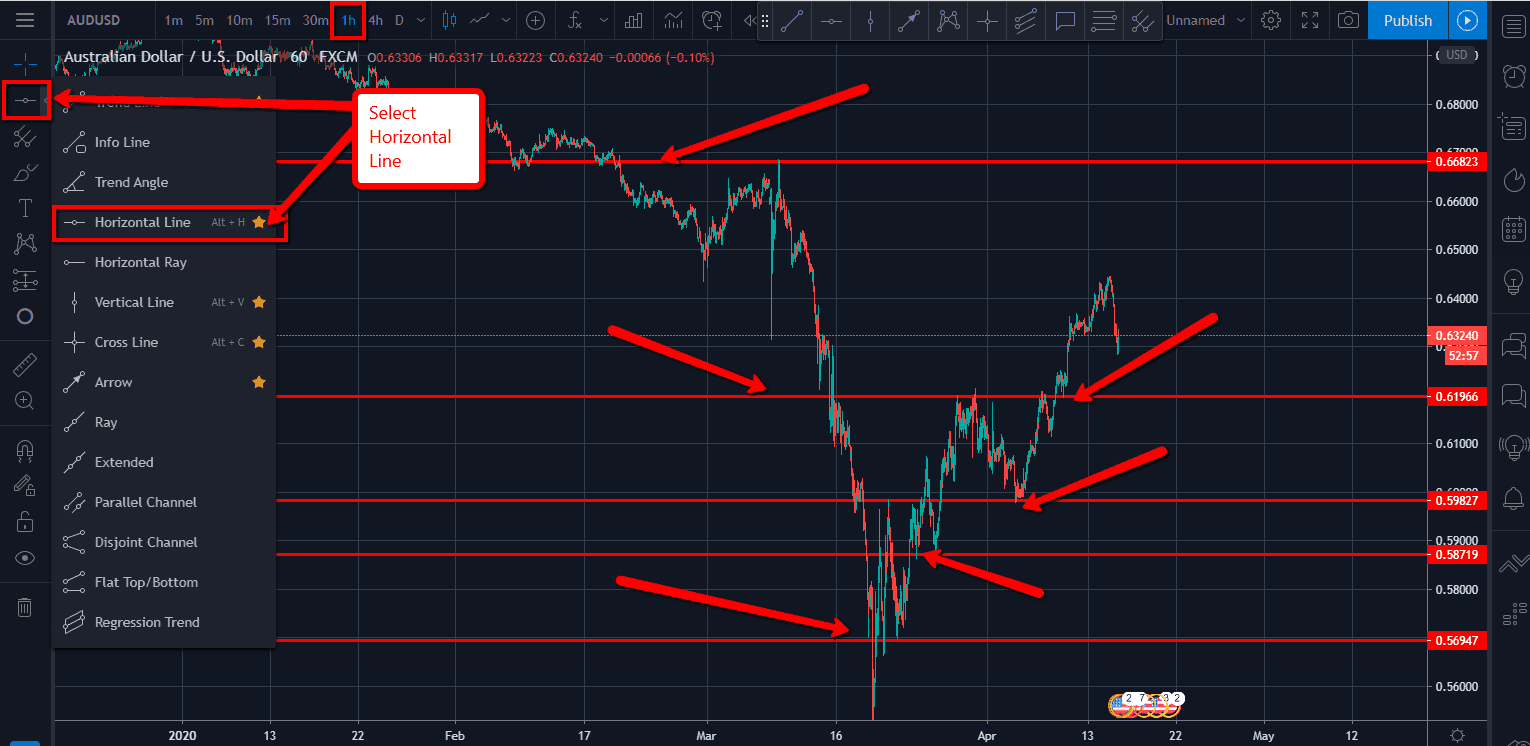
- Select Horizontal Line (Second Option Down On Left) or use “Alt+H” Keys
- Go Back In History To Find Major Reversal Points
- Click and put Horizontal Lines At those points
You should start around where the current price is then you can expand from there when you want to. You can take it one step further and set an alert on your support/resistance line so you can immediately jump on the charts to see if there is a possible trade or not.
Below we will be going over alerts and indicators to make it easier for you to trade. I would in the beginning make sure you yourself know how to draw these accurately as we will be giving examples.
Support and Resistance will only take you so far without the great forex training. If you would like to skip the line and become a Funded Trader (FTMO) as soon as possible for a SPECIAL 2 WEEK FREE TRIAL ALL INCLUDED ACCESS CLICK HERE! This is no B.S. training that will be live changing. Get in while you can for FREE!

Best And Easiest Way To Draw Support/Resistance TradingView
This is the easiest way we have discovered to draw support and resistance using lines in TradingView. With this you can quickly get your lines drawn and get your alerts set so you can go about your day waiting for price to come to you. This is basically like setting a trap you wait for it to come to you. You do not want to be trading in no mans land that is where retail traders like us lose all their money.
Okay so for this example I will use AUDUSD. I will start on the 1 hour using the horizontal line tool. Start with any major reversal points and points of exhaustion.
After I have completed on the 1 Hour I will move to the 4 Hour. Lastly I will move up to the Daily. This works the same for any timeframe if you trade off the 5 minute then go to 15 minute, 30 minute and 1 hour at least and maybe add in the 4 hour if needed.
We take a lot of our trades off the 1 minute and 5 minutes charts or at least enter our trades but our analysis is almost always up to the 30 minute at least. This is up to you no timeframe is really better then the other it is fun to scalp and it is fun to swing trade that is why I do both depending on how the setups are coming in.
1 HOUR CHART
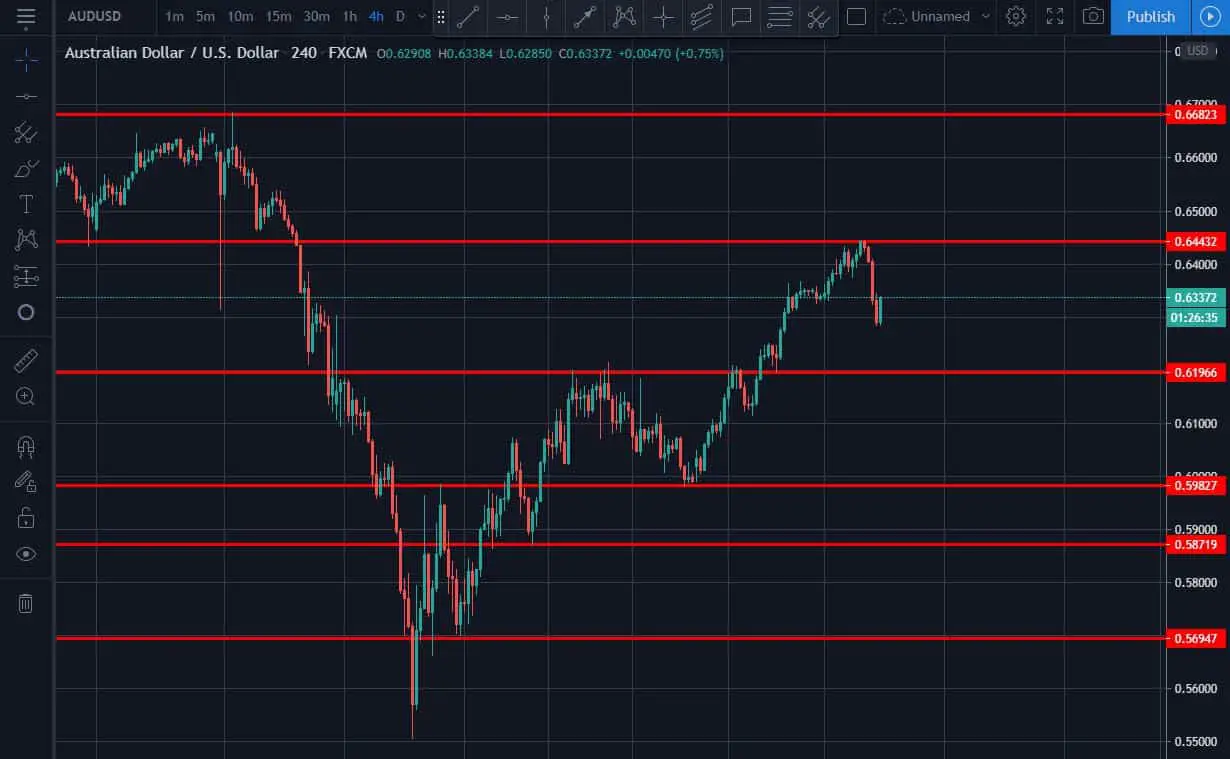
4 HOUR CHART
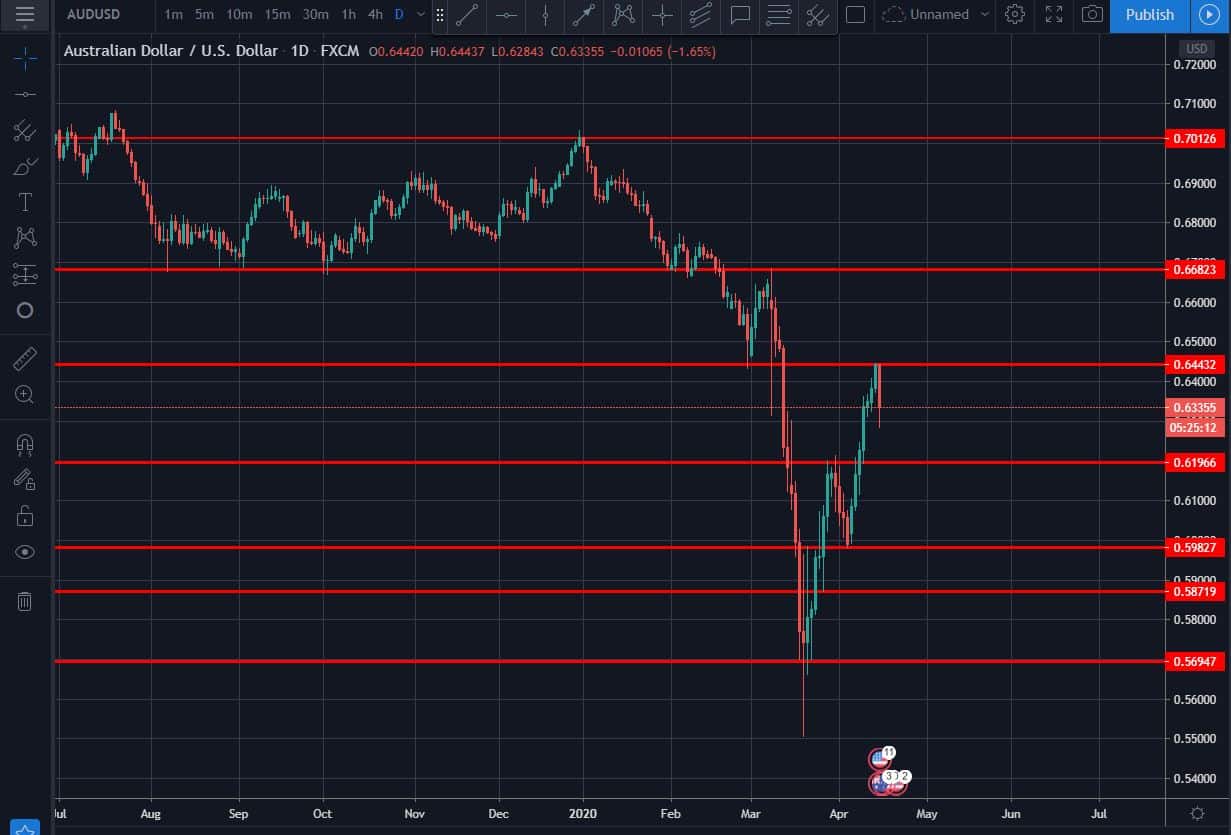
Daily Chart
Best Support/Resistance Drawing Tools TradingView
Horizontal Line Tool – The horizontal line is definitely where you want to start or you can do what we do if we are drawing up on different time frames you aren’t going to be able to be as exact and you should always set a trap and react. The higher the time frame the more slush there will be in terms of your stop loss.
Fib Retracement Tool – This is amazing and anyone who knows me knows I love Fibonacci. You can use this tool by itself to find where the standard fibo numbers with be sufficient starting out. There are so many numbers out there for fibonacci that can be used in Forex it is crazy.
Rectangle Tool – What we like to use is the rectangle tool as well. So you get a much better support and resistance zone. This can be found right in the same tool bar area. The only difference is that it isn’t extended out in the future. So you just need to go to the settings and enter in a high number to do so.
How To Draw Rectangle In TradingView For Support/Resistance Zone?
- Go to your tool bar on left side select tool drop down 4th one down
- Select second option down (Rectangle)
- Click where you want the line to be then extend with your mouse until you are at the end of your screen and click again
- You can adjust the thickness and length
- To extend length beyond end of screen go to settings, coordinates, #2 (Price, Bar), second column change to much higher number so if 200 for example change to 1200 to extend it.
You can use these tools by themselves or you can combine them. I like to combine the Horizontal Lines with Fibonacci you can get more exact for entries for sure. Simple trading can be done with these tools just by looking for breaks or rejections.
You can also combine these tools with New Paradigm trading with things such as Trend Lines and Pitchforks or even Fib Channels which I have come to love. What you are basically looking for are energy points that are stacked confirmations putting the trade more in your favor.
Best Support/Resistance Indicators TradingView
There are many indicators out there that give you in depth looks at possible support and resistance. You can do a simple search in TradingvView scripts or even google to find some nice free ones.
We have a couple that we use that our free membership includes.
Auto Support and Resistance Indicator TradingView – our indicator works on all time frames basically has a more solid line for stronger support and resistance and more dotted line for weaker support and resistance.
INS 2.0 – This is an amazing piece of software put into this indicator so it can take up some space on the old hard drive while it is running. This is loaded with Harmonic Targets, Cmarilla Lines, DC45 Lines, Fibo Pivot Lines, DP30 Lines, and PSR (Potential Support and Resistance) line. I know a lot there, but all you really need to know is that this is based on live and historic data that you can look to trade off of. Amazing tool created by THE Steve Gregor. You can get this tool by joining his Facebook Group.
Moving Averages – yes moving averages can be used as well for support and resitance. They are more like rolling S&R, but I know people that this is all they trade. They stack a ton of moving averages on their screen and trade based off the breaks and resistance of those stacks. We mainly use the 62 EMA as a support and resistance. We have found that when it breaks through the 13 it will hit the 62 then come back and re-check it many times as well. We also have a free moving average indicator that was built after the Alligator Strategy that is a group of moving averages that you get into trends with based on the break.
Final Thoughts
Drawing Support/Resistance lines is a great area to start your trading journey. As we stated always start by manually drawing them first before using our Auto Support/Resistance Indicator. This way you will always know what you are looking at.
You should combine as many tools are you are comfortable with. Start with drawing simple S&R then expand to using the Fibonacci tool you will not regret. It is not something you need to really understand. Honestly the more you dive into Fibonacci reading about it the less likely you are to believe it. Seeing is believing.
Draw your support and resistance lines on a chart. Then go back to some major swing highs and lows to get a basic for your fibonacci anchors. Then extend those lines out and save the chart. Trust me when they start hitting those energy points there will be some shakeups either some reversals or breaks and re-checks. Not all of them of course but it does happen over and over again.