One of the reasons I use TradingView for marking up all my charts is the ease of use and functionality of the product. You can literally do just about anything you can code inside of TradingView without knowing how to code really. Somebody as has probably already done what you are thinking about so you can simply search for an indicator just like Moving Average On RSI. Even if you want nothing to do with coding you can go to a place like Upwork or Fiverr to get your indicator coded for you for minimal amount of money.
So how can you quickly add moving average to RSI in TradingView?
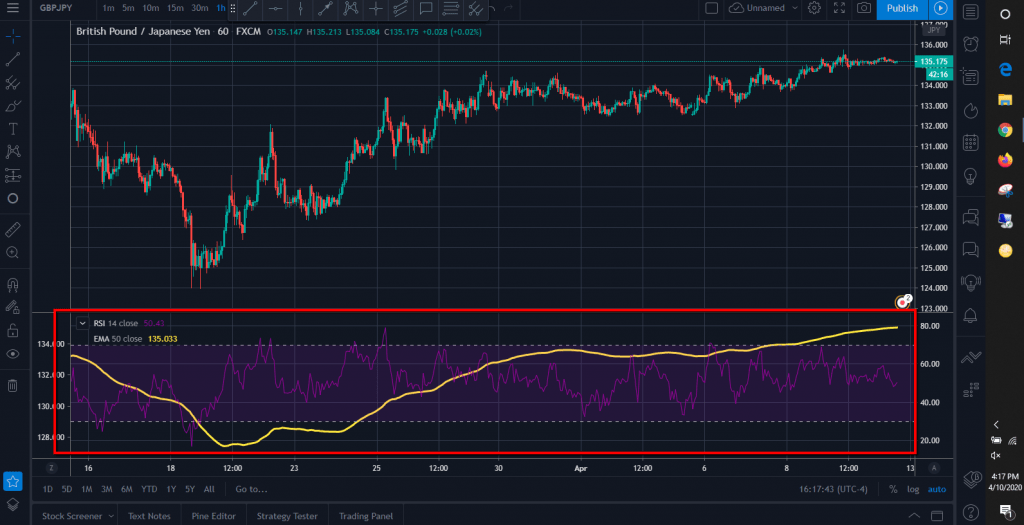
It is actually very easy to add any moving average to your RSI indicator. All you need to do it follow these simple steps:
- Open Chart
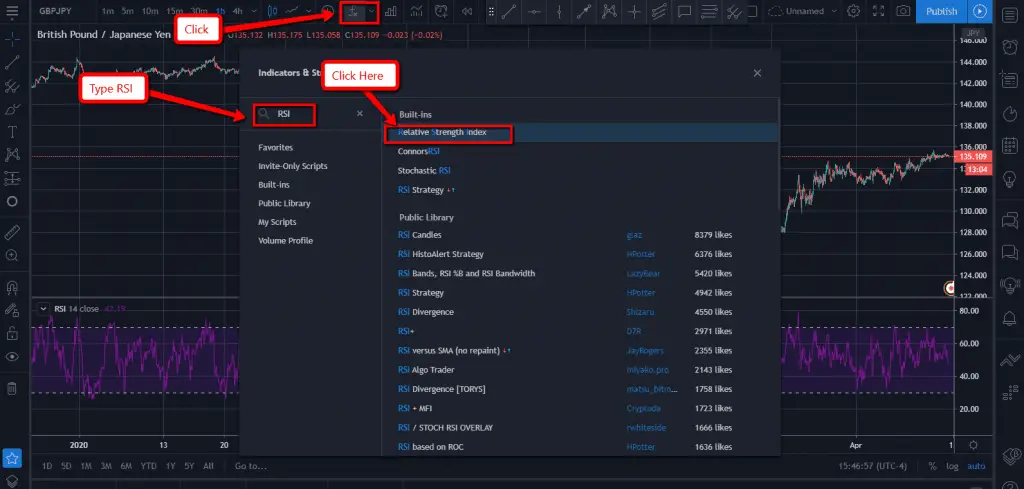
- Go to add indicators
- Add RSI as normal
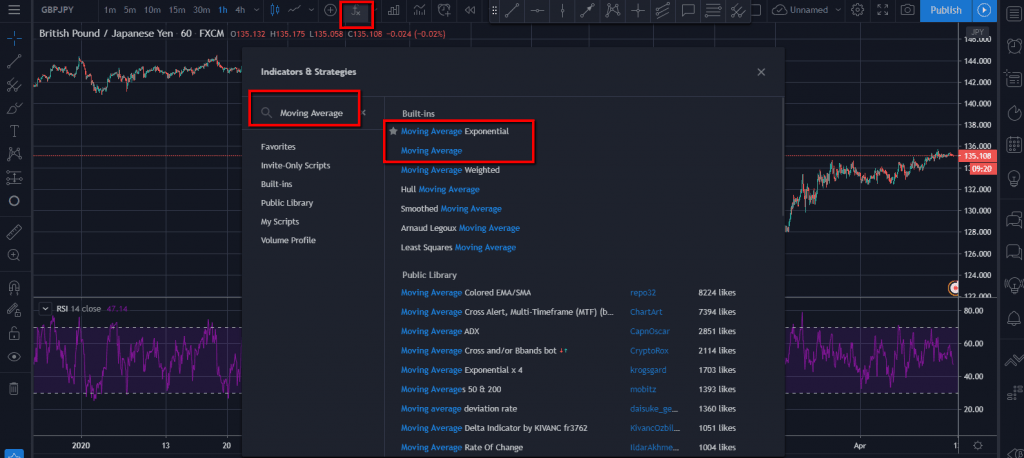
- Add Moving Average As Normal
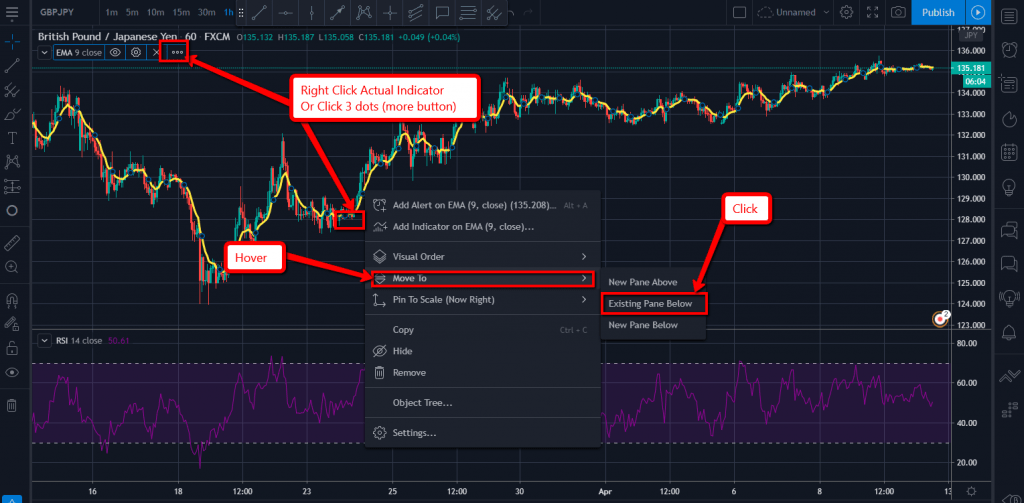
- Right click on Moving Average on chart
- Scroll to “Move To” and hover
- Click on “Existing Pane Below”
- That’s it
Now you can change the setting of your RSI and Moving Average if you haven’t already done so. I like to keep it at 14 then I will also add on another Moving Average. I also use mostly Exponential Moving Averages. So one I use would be the 13 62 cross and bounce. You can add more indicators into your RSI as well We have a great free indicator that shows RSI divergence for possible Buy and Sell Scenarios you can find HERE.
Indicators will only take you so far without the best forex training. If you would like to skip the line and become a Funded Trader (FTMO) as soon as possible for a SPECIAL 2 WEEK FREE TRIAL ALL INCLUDED ACCESS CLICK HERE! This is no B.S. training that will be live changing. Get in while you can for FREE!
Adding Moving Average To Your RSI Indicator In Tradingview
1. Open up a New Chart or A Saved Chart doesn’t really matter.

2. Go to add indicators and add RSI as normal
3. Add Moving Average As Normal
4. Right click on Moving Average on chart
5. Scroll to “Move To” and hover
6. Click on “Existing Pane Below”
That’s it
TradingView RSI
The Relative Strength Index (RSI) is a momentum based oscillator indicator that measures speed and change when it comes to directional price movements. It gives you basically the current and historical strength and weakness of the market you are looking at. It is all based on the closing prices over the duration of the period you are using and of that timeframe you are on. RSI is definitely a applicable tool to add to your list of confirmations. It is a lagging indicator however since it is based on closed prices. If you want to know more on real time indicators check out our page on trading the New Paradigm
Indicator On Indicator TradingView
Just like we show above you can perform indicator on indicator with almost anything you want to use. I have several different free indicators I either developed myself or had developed that are overlays so you can put them on indicators as well.
We do have a premium account now that we use, but in the beginning Free is best to start with and then jump to probably Pro+ then to Premium from there. If you can just let the software pay for itself. If you are following a simple strategy like and RSI/Moving Average strategy maybe add in some support/resistance zones and some price action that is all you honestly need if you demo, demo, demo. Get your VOT (Volume Of Trades) in before you move to live.
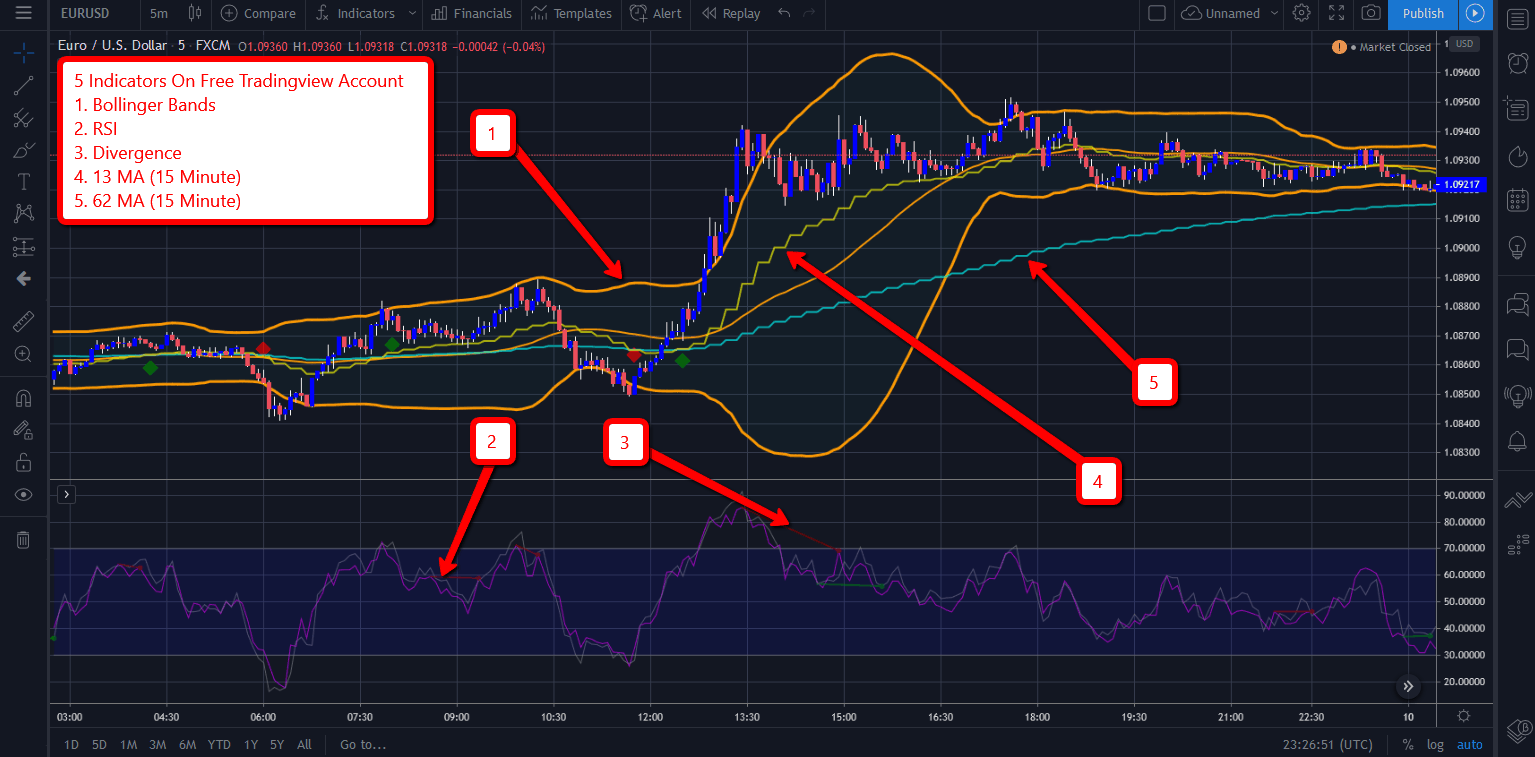
Indicator on Indicators work great. I use what is called a Divergence Indicator over RSI. Basically I wait for RSI to be above 80 or below 20 then I need some more confirmations. This could be a bearish/bullish 5 minute candle on top of hitting a major support/resistance zone or going a Moving Average crossover which indicates a momentum change. I like using the 13/62 crossover with the Exponential Moving Average. We actually have a free indicator that gives buy/sell alerts you can see these along with some other indicators I use below.
How To Add 50 Day Moving Average In TradingView
You can use any moving average and the 50 day does happen to be one of the moving averages I use with what is called the TNT strategy. There are a couple options you can do if you like using the Bollinger Bands which I do with the same strategy you can add that to your main chart then just take out the Basis of the Bollinger Bands.
In order to put the 50 Day Moving Average on your charts you need to follow these simple instructions:
- Open Daily Chart
- Go to add indicators
- Type in Moving Average in the search
- Click Moving Average
- Right click on Moving Average on chart
- Scroll to “Settings” on the bottom
- Under Inputs Tab Change Length To 50
- Click Okay
- That’s it
That’s how you get your 50 day moving average. You have to be on your Daily chart. Now you can get a 50 day moving average on your 4 hour and 1 hour as well you just have to do the math calculation. Just break down the candles into how many per day then multiply that by 50. Yes it sounds confusing but it is very easy.
The main area we use this is for our 13 and 62 moving averages all the way to using the 30M 62 Moving average on a 1M Chart. There are many reasons you may do this, but for us it is looking for that essential early entry. Trading in the New Paradigm we enter most all our trades on the 1M or at least the 5M chart.
4 Hour 50 Day Moving Average: 6 candles equals one day on a 4 hour chart. With that being said we would take the 6 and multiple it by 50 to get the 50 day moving average on your 4 hour chart.
6 X 50 = 300 <= So all you would do is enter the length at 300 to get your 50 day moving average on the 4 hour chart
1 Hour 50 Day Moving Average: 24 Candles equals one day on a 1 hour chart. With that being said we would then take the 24 and multiply by 50 to get that 50 day moving average on your 1 hour chart.
24 X 50 = 1,200 <= So all you would do is enter the length at 1,200 to get your 50 day moving average on the 1 hour chart.
Now if you want to skip the math and just use one of our indicators where you can have multiple moving averages on your charts from different time frames all on one indicator then sign up for our 100% Free Membership to get this indicator along with our other ones 100% free on Tradingview and MT4. CLICK HERE
RSI Moving Average Crossover Strategy
This is a strategy we have used in the past and it does work so try it out and back test as much as you want. With the RSI being very versatile in nature you can attach to almost any strategy. In the beginning however you don’t want to create too much of a mess on your charts so try to keep it simple and have a simple printed out checklist even.
The standard RSI setting is 14 which you can honestly use on any chart once you get used to it however it is most commonly used on Daily charts so you may want to change it and experiment a bit. For example with what we are going to show you on the 1 hour chart we usually use 21 for our setting on the 1 hour time frame. Then 28-32 on 15 minute charts. Again experiment a bit or look do more research on that.
RSI Trend Trading – This is a trend trading strategy just like most Moving Average strategy are. You need a pair to be trending up or down in order for this work efficiently. So up trend you want higher highs and higher lows and for a downtrend you want lower lows and lower highs in price.
You are only going to be taking takes in the direction of the trend so buys for an uptrend and sells for a downtrend.
This example will be on the 1 hour time frame but can be used on any time frame. We are going to be using RSI set at 21 and a moving average of 13. This will be your indicator on indicator.
Your exit can be up to you if you have something in mind for this example we will simply using the Bollinger Bands with a setting of 50. So when it gets to Basis (middle line) you can move your stop loss into profit or at least Break Even. Then when it gets to Upper/Lower line you can either move stop loss up further into profit, close a half lot, or close it all out.
You can also move your stop loss into profit after 10-20 pips if you want. Traders choice really. A lot of traders will have the same entry technique, but their exit strategy will all differ.

Entries
- RSI Above 60 (Sell) or Below 40 (Buy)
- As soon as RSI is above 60 and crossing over Moving Average enter on next candle close in right direction
- Set Stop Loss to last high or low in this case it is about 15 pips. I normally set a hard stop loss of a bout 30 pips on a 1 hour chart.
Exits
- When it goes to Basis (50 moving average) move stop loss to BE or a couple pips profit
- Reached lower or upper move SL to more profit, partial close, or close out completely. Traders choice
That is pretty much it. You can back test this just look for where a trend is already established then look for that pull back and entry. Very simply once you get it down. I wouldn’t focus really any attention on the exits just put 100% into the entries then move onto the exits. Demo, Demo, Demo and backtest. Backtesting it okay but you need to actually demo these kinds of trades you can setup alerts as well.
There is great apps out there for a lot of strategies using what is called Dashboard by Easy Indicators. They have a free version as well then if you want something specific for settings and custom alerts I believe it is like $3.99 a month or something. You can do the alerts on TradingView of course I believe there is only 1 alert available on the free version then it works its way up to unlimited on the Premium.
Related Questions
How Do You Set RSI On TradingView?
Setting up your RSI is very easy on TradingView
- Click on Indicators
- Search “RSI” and click on it to add to chart
- Click the setting icon
- Set it to whatever you want the default is 14
Final Thoughts
RSI was actually one of the first indicators I used along side Harmonic Patterns. I used to use what was dubbed the Quick Fire Strategy It can be used with almost any strategy honestly. For the quick fire we basically looked for RSI to be above 80 or below 20 then if there was divergence on the RSI with price actions it was game on. I always found divergence to work great with RSI with it be continuation or reversal divergence which is why I developed a couple indicators for Divergence to be used with RSI.
They both came out great and can you can have them for free if you want all you have to do is go HERE and you can also sign up for your Free TradingView account here where you can get the best deal if you ever upgrade along with all my future indicators for free. We show you how to make the most of a free account along with using a Premium account. I have always believed you get out of something what you put in that is why all my indicators are free and always will be unless I spend thousands of dollars having one developed.
I would start with a free TradingView account they have some great deals after you sign up for 30 days or around Black Friday so don’t sign up before you use the free version for 30 days or get it on Black Friday. I would wait until you have made enough money trading to invest it into a year of TradingView membership costs first if you can.