
The major reason behind the success or failure of the trade is the skill of drawing supply and demand zones. The price never becomes stagnant in the forex market. If the price becomes stagnant for a long duration of time, it means the supply and demand in the market are perfectly balanced, which is not possible.
How to Draw Supply and Demand Zones in Forex?
So how do you draw supply and demand zones in Forex?
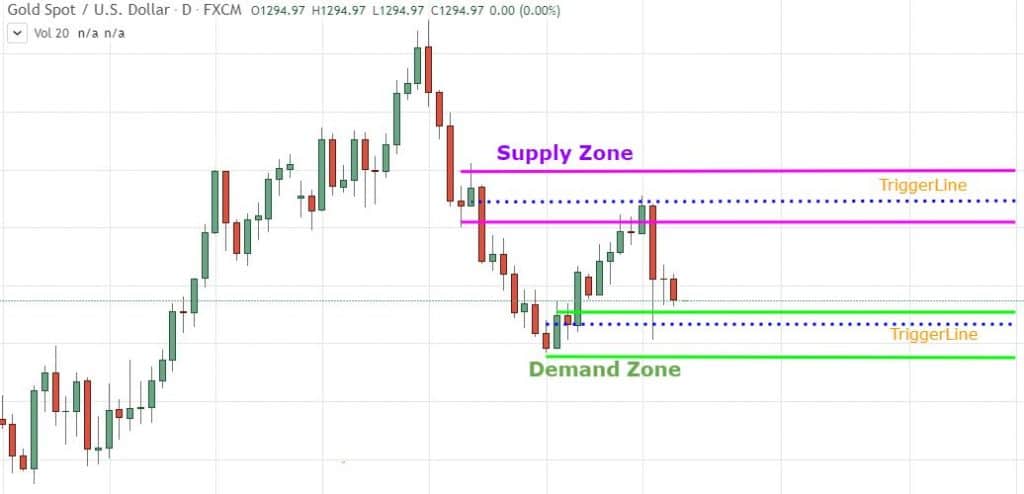
You draw supply and demand zones are drawn mostly on higher time frames you are looking for areas where there has been resistance and no breaks. Supply is where someone is will to sell off (big drop) and demand is where someone is willing to buy up (big climb). It is not exact to the pip that is why you use a zone then your entry criteria which could be price action.
Here is an example of supply and demand on the Daily chart for XAUUSD Gold/Dollar.
What are Supply and Demand?
The price fluctuations in the forex market occur just because of the demand and supply. When there is an imbalance in the demand and supply in the market, there the price fluctuates. Talking about demand, it is the level at which the person is willing to buy. Supply is the level at which the person is willing to sell.
No matter whether it is the stock market, commodity market, forex market, or any other market, every market is working on the principles of demand and supply. It is all about how many people are willing to buy and how many people are willing to sell.
What is Support and Resistance in Forex?
Support is the price level when the price falling stops. It is the level where the demand is stronger than the supply. At the support level, the price bounces back upward.
Resistance is the price level when the rising stops. It is the level where the supply is stronger than the demand. At the resistance level, the price falls down.
Basically, there is no fix position for support or resistance levels. If it starts breaking the support or resistance, the price will continue with the next level of support or resistance.
Before we talk about how to draw supply and demand zones in forex, first understand what are supply and demand zones:
About Supply and Demand Zones
Knowing about demand and supply zones can be really beneficial. The major advantages of supply and demand zones are a minimum risk factor, the high-profit potential, they can be found easily, and they have more risk to reward ratio.
Demand Zone
In the demand zone, the buyers are dominated to buy and there becomes the maximum buying pressure. Advantages of the demand zone are:
- Minimum risk factor
- High-profit potential
- A bit easy to find the right trade
- Easy to identify the area
- The risk to reward ratio is more
In order to identify the demand zones, you need to follow these steps – first, you need to take a look at the chart, there you need to take a look at the left-hand side of previous low where the strong rally has been started. Now you need to find out the origin or the start point of that strong rally.
Once you find that, draw two parallel lines – one at the low and another one at the close. So that’s how demand zones are drawn. Now, let’s discuss the supply zone.
Supply Zone
The supply zone is just opposite to the demand zone. In the supply zone, the sellers are dominated to sell and there becomes more selling pressure for the traders. The supply zone comes with many advantages. Here are some major advantages of supply zone:
- There becomes the minimum risk factor
- You will have great profit potential
- A bit easy to find the right trade
- Easy to identify the area
- Higher risk to reward ratio
In order to identify the demand zones, you need to follow these steps – first of all, you need to take a look at the chart. There you need to look at the left-hand side of the previous high where the previous strong downtrend starts. After that, you need to find out the origin of the strong downtrend. After finding the supply trend, you need to draw two horizontal parallel lines – one at high and second at the nearest close
Tips for Supply and Demand
The demand and supply factors can be measured on the forex chart. Before you start drawing supply and demand zones on the forex chart, you need to consider the tips given below:
1. Use longer time frames
Before drawing the supply and demand zones, make sure you are using longer time frames. In order to use longer time frames, you just need to zoom out the forex chart. This will give you a proper idea about when the price fluctuated.
2. Identify strong moves
Another important thing you need to keep in mind while drawing supply and demand zones is to identify the strong moves. Identifying the strong moves of demand or supply will give you an idea about when actually was the trend started and when it reverted back.
3. Moderate volatility
High volatility in the forex chart may not give you a proper idea about the trend. Narrower price behavior in the chart before the breakout means there will be the chances of seeing a better trend.
4. Use indicators
Another great tip for drawing demand and supply zones is to use indicators for confirming the support and resistance zones. Using different indicators for supply and demand zones will help you understand the chart properly.
5. Timely exit
A good supply zone would be narrow and it won’t spend too much time on the zone. Shorter accumulation zone gives a better idea about reentry when the market reverts back.
Drawing Supply And Demand Zones Continued
As we know, demand and supply play an important role in any market. The price fluctuations in the market are the result of an imbalance in demand and supply. Knowing how to draw demand and supply zones will give you an idea about the market sentiments so that you can make better trading decisions.
The process of drawing the demand zone in the forex is similar to the supply zone. For the demand zone, you need to take a look at the chart’s left-hand side of the previous low. On the other hand, under for supply zone, you need to take a look at the chart’s left-hand side of the previous high.
The process for drawing supply and demand zones is very similar, there’s just a minor difference. Here’s how to draw supply and demand zones in forex:
- First of all, take a look at the chart
- Now, take a look at the left-hand side of the previous low, if you want to identify the demand zone. Similarly, if you want to identify the supply zone, take a look at the left-hand side of the previous high.
- Check out the start point of the strong rally in the chart
- Now you need to draw two horizontal parallel lines. Draw the first line at the low and second line at the nearest close, if you are drawing the demand zone. Similarly, if you are drawing the supply zone, you need to draw the first line at the high and second line at the nearest close.
Supply and Demand For Beginners
Below are real traders answers to beginners on how to understand and draw supply and demand zone.
We curated this information from several different forex forums. Only grammar or spelling was corrected other then that the answers remain the same.
Real Trader Opinions
1. AUdvantages “Long term charts” – Look at price levels most prevalent in long-term charts. This will illustrate where supply/demand levels are on buying or selling the instrument. For example, a price range that trades most frequently in a chart or ranges of commonly approached supports and resistances.
2. Luke_Ronchi “Support and resistant levels on charts” – Basically; supply & demand zones are known as support and resistant levels on our trading chart.
3. ESWairuri “Where price will touch and reverse” – Supply and demand zones, basically indicate where prices are likely to touch then reverse.
These zones can be identified using a longer timeframe (I personally use 4hr). From there, look for a breakout candle to the opposite direction of the current trend. After which draw a rectangle starting from the wick of the previous candle to the close of the breakout candle. (In supply zone this is usually from the bullish candle wick to the close of the bearish candle), extend the rectangle to the future, in order to help you know when price approaches this zone.
The opposite applies for the demand zone.
4. Hoilo “Economy books will help overall understanding” – I would also suggest to you to read some quality books on economy in order to understand better concepts of supply and demand as these are most common economic terms. With understanding of these concepts you will be able better to understand how to spot them on the chart
5. HiddenGap “Don’t use for trade signals by themselves” – I am a firm believer that Supply/Demand Zones and Support and Resistance are not trade signals in and of themselves.
As one begins his journey down the Supply/Demand path, he does need to ask himself this question: “Am I a Supply/Demand Zone signal trader, or am I a Supply/Demand Zone Price Action trader”?
A Supply/Demand Zone signal trader (aka a “touch”) will be looking to place limit orders at the top of a Demand Zone or just within it. And conversely, he would be looking to place a limit order to short at the bottom of a Supply Zone or just within it. This type of trader is also called a “set and forget” trader.
The Supply/Demand Zone Price Action trader is looking for Price to do something specific once it gets to the Zone.
Take a look at the chart below.
Again, while I am not using Supply/Demand Zones as such, you can see what I mean. If you were a Supply/Demand signal trader and you had identified that green area as Demand, you would have gotten into this trade-assuming your limit order got filled. All you would need is a “touch” of the zone. A Supply/Demand Zone Price Action trader most likely would not have gotten into this trade. That depends of course on the particular Price Action he would be looking for.
Now take a look at the red area. Let’s again assume this area is a Supply Zone rather than a Supply/Demand Delta Zone via WRB Analysis. The “touch” trader would have placed a limit at the bottom of the Zone and then would have been brought into the market as the White (open<close) WRB breaches the zone. Stop placement is typically at the opposite side of the Zone, and this trade would have ended up a loss. No big deal, there is loss in trading.
But this is where the Supply/Demand Zone Price Action trader would be looking to enter the market short. Whether or not a short is entered depends on the Price Action set-up the trader is looking to see.
One place where many traders go wrong is in trying to be both. It does not work. Think about it. If you are a touch trader, the more time price spends in a Zone the “less” strength of the zone. A “touch” trader wants price to touch the zone and then rocket out. This is the opposite of what the Price Action trader wants. He wants price to spend enough time in the zone to create an entry signal. That entry signal can be a 1 interval or 12 interval pattern.
Conclusion
The price fluctuations in the forex market occur just because of the demand and supply. When there is an imbalance in the demand and supply in the market, there the price fluctuates. Drawing the supply and demand zones will give you an idea about demand & supply fluctuations and the trend of the market.
By drawing supply and demand zones, it would be a bit easy for you to find the right trade. And, you will also have a higher risk to reward ration. So here we have shared how to draw supply and demand zones in forex. Apart from this, we have also shared some tips for demand and supply zones.